Overview
A field report on in-field kava cultivar identification by handheld near-infrared spectroscopy. Five cultivars separated at 97.7% fitted accuracy in a single-day, three-site dataset; the two cultivars with enough independent sessions to cross-validate properly were recovered at 100% and 95%, one across two separate sites. The report sets out what the 2018 sampling design could not control, the six-rule collection protocol that came out of the reanalysis, and the multimodal leaf-plus-stem classifier now returning accuracy in the 85% range under leave-one-day-out validation.
Abstract
Over ten days in November 2018 the Association and KavaLytics collected 2,506 leaf scans in 51 independent scanning sessions from 15 named cultivars at six sites across four Hawaiian islands, scanning plants where they grew and harvesting no material from any of them. The question was a practical one: can a handheld near-infrared spectrometer, operated on living foliage by one person walking a field, tell kava cultivars apart well enough to be worth building into a working tool?
In the strongest sub-dataset — five cultivars scanned across three Hawaiʻi Island sites on a single day — linear discriminant analysis of standard-normal-variate-corrected spectra separated the cultivars at 97.7% fitted accuracy. Validated by withholding entire scanning sessions, the two cultivars sampled in more than one session were recovered at 100% (Honokane Iki) and 95% (Mahakea), the latter across two geographically separate sites. Generalisation across collection days was weaker: models trained on one day and tested on another recovered four cultivars at 51.9%, against a 32.4% majority-class baseline. This report sets out the three constraints the 2018 design could not control, the collection protocol that came out of the reanalysis, and the multimodal leaf-plus-stem classifier now under development, which returns accuracy in the 85% range under the same leave-one-day-out validation.
Key Findings
- Five cultivars separated at 97.7% fitted accuracy in a single-day, three-site dataset of 129 leaf scans — measured on living plants in the field, with nothing harvested.
- Two cultivars had enough independent sessions to cross-validate properly. Honokane Iki was recovered at 100% and Mahakea at 95%, the latter across two geographically separate sites — the strongest indication in the survey that a cultivar signature survives a change of growing location.
- Across collection days the signal weakened: four cultivars recovered at 51.9% against a 32.4% majority-class baseline (p ≈ 1 × 10⁻⁹). Well clear of chance, and short of a deployable classifier.
- Statistical power comes from sessions, not scans. Consecutive scans of one leaf correlated at a median of 0.9997, so 2,506 scans in 51 sessions carry the precision of 51 observations.
- Leaf hydration can overwhelm the cultivar signal completely. Four sessions recorded water-band absorbance around half the working range; one is retained in the analysis as a worked illustration of the artefact.
- Adding stem imagery lifts cross-day accuracy into the 85% range under the same leave-one-day-out validation that returned 51.9% for leaf spectra alone.
A grower cannot tell these plants apart by looking
Cultivar identity governs what a kava plant is worth and how it may be sold. Vanuatu and Fiji permit noble varieties only, and growers there have reported receiving nursery stock of the tudei variety Palisi supplied to them as noble Borogo or melo melo. In Hawaiʻi the confusion is a visual one: the introduced cultivars ISA and IWI, and the Micronesian varieties Rahmwanger and Rahmadel, share green stems and black spots with the Hawaiian cultivar Nene and are routinely mistaken for it.
The cost of that mistake is measured in years. A grower may wait two to four years for a crop before discovering the plant is not what the label said. Visual and organoleptic assessment are the only non-destructive checks available at the nursery stage, and both are known to fail. Every alternative requires harvesting root material, which risks infection and the loss of the plant — an unacceptable price for routine quality control.
In November 2018 the Association and KavaLytics went to Hawaiʻi to ask a narrow, practical question: can a handheld near-infrared spectrometer, operated on living foliage by one person walking a field, tell kava cultivars apart well enough to be worth building into a working tool? The object was not to validate a classifier. It was to find out whether the signal exists, and what it would take to measure it properly.
The 2018 survey
Over ten days, 17–26 November 2018, we collected 2,506 leaf scans in 51 independent scanning sessions from 15 named cultivars at six sites across four Hawaiian islands. Every plant was a mature, established specimen scanned where it grew. Healthy leaves from the middle to upper canopy were presented directly to the instrument, and no material was harvested from any plant.
Scanning used an NIR-S-G1 handheld instrument (InnoSpectra, Hsinchu, Taiwan) in diffuse reflection mode over 900–1700 nm, against a 99% reflectance reference recalibrated after every ten samples. Conditions on the principal collection days were about 27 °C and 84% relative humidity. Each session carried an automatic GPS fix and timestamp, which is what later made the site and time analyses possible.
The survey in numbers
- 17 Nov — Honolulu, Oʻahu. Papa Kea and Nene. 118 scans, 4 sessions.
- 18 Nov — Upcountry Maui. Hanakapiai. 34 scans, 1 session.
- 19 Nov — Maui Nui Botanical Gardens. Nine cultivars. 480 scans, 20 sessions.
- 20 Nov — Hawaiʻi Island, three sites. Hiwa, Honokane Iki, ISA, Mahakea and Nene. 363 scans, 9 sessions.
- 25 Nov — Lyon Arboretum, Oʻahu. Nene. 18 scans, 2 sessions.
- 26 Nov — Puʻu O Hoku Ranch, Molokaʻi. Fifteen cultivars. 1,493 scans, 15 sessions.
The analyses below were run on the portion of that survey for which raw spectral records survive for reanalysis: 434 scans in 36 sessions across the first five collection days. Spectra were trimmed to 900–1650 nm, corrected by standard normal variate transformation, reduced to eight principal components and classified by regularised linear discriminant analysis. The channels above 1650 nm were discarded once inspection showed them to be detector noise; keeping them inflated every between-cultivar distance three- to four-fold and reordered the apparent ranking of the cultivars.
What the spectra showed
The strongest sub-dataset was 129 scans of ISA, Hiwa, Mahakea, Nene and Honokane Iki taken on 20 November at three sites on Hawaiʻi Island. Discriminant analysis separated the five cultivars with a fitted accuracy of 97.7%. Honokane Iki occupied distinct territory at one end of the first discriminant function, Nene and Hiwa at the other, with Mahakea in the space between and partially overlapping both.
Fitted accuracy is not the number that matters, though. Validation here was done by withholding entire scanning sessions rather than individual scans, because consecutive scans within a session come from the same leaf: holding out one scan while its siblings stay in the training set does not test whether the model generalises, only whether it can recognise a leaf it has already seen. Only cultivars sampled in two or more independent sessions can be validated at all under that scheme.
Session-level validation
- Honokane Iki — 2 sessions, 17 scans, recovered at 100%, at Hamakua.
- Mahakea — 3 sessions, 37 scans, recovered at 95%, across Waimea and Waimea North.
- Hiwa, Nene and ISA were each scanned in a single session and are not evaluable under this scheme.
The Mahakea result is the most informative single finding in the survey, because those three sessions span two geographically separate sites. A cultivar signature that survives a change of growing location is the thing a field tool would actually need.
Generalisation across collection days was weaker. Models trained on one day and tested on another recovered four cultivars at 51.9%, against a 32.4% majority-class baseline (p ≈ 1 × 10⁻⁹). Better than chance by a wide margin, and well short of a deployable classifier.
Three things the 2018 design could not control
Each of these has a direct remedy, which is why they are set out plainly rather than buried.
Scans within a session are not independent
Across the 36 reanalysed sessions the median pairwise correlation between scans of the same session was 0.9997, with a range of 0.9985 to 0.9999. Consecutive scans are near-duplicates. The effective sample size of the reanalysed set is 36 independent observations, not 434, and any accuracy computed per scan will read high. Because the same scanning practice ran through the whole survey, this applies to all of it: the number of sessions, not the number of scans, sets the statistical power.
Discriminant structure tracked session time
At the Maui Nui site, where each cultivar was scanned in one contiguous block, the second principal component correlated with elapsed time since the session began (r = +0.24, p = 1.8 × 10⁻⁴, n = 241). Cultivar order and clock time were fully confounded in that session, so an unknown share of the separation there belongs to instrument or ambient drift rather than to the plants.
Leaf hydration can overwhelm the cultivar signal
Four sessions recorded absorbance at the 1450 nm water band between 0.21 and 0.30, against 0.60–0.76 (median 0.65) for the other 32. Water dominates absorbance in this region, so samples in that condition separate on hydration state rather than on cultivar chemistry. Three of the four were excluded from the analyses above. The fourth — the ISA collection of 20 November — was kept and flagged as a worked illustration: it sits about seven times further from the other four cultivars than any of them sit from each other. Excluding the water band does not close the gap, which confirms the affected spectra differ in baseline and scatter across the whole range, as desiccated tissue would. That displacement is an artefact, not evidence that ISA is spectrally distinctive.
What the survey changed about how we collect
The signal appears to be there. The 2018 study design was not built to measure it cleanly, and the fixes are procedural rather than instrumental. Every collection since has followed six rules that came directly out of the reanalysis.
- Scan independent plants — one scan per plant across many plants, rather than many scans of one leaf.
- Interleave cultivar order through each session, so identity is never confounded with elapsed time or instrument drift.
- Sample every cultivar on at least two separate days and, where possible, at two or more sites, so a model can be validated by withholding a whole day.
- Record and screen leaf hydration, flagging or rejecting sessions whose water-band absorbance leaves the working range.
- Confirm cultivar identity on a subset by HPLC chemotype or DNA fingerprinting, to break the circularity of validating against the grower records the method is meant to replace.
- Report accuracy at the level of independent plants or sessions. Never per scan.
Where the work stands now
Development did not stop with the 2018 spectra. The current line of work at KavaLytics combines the leaf near-infrared spectrum with photographic imagery of the stem — typically three views per plant — analysed by a neural network so that the two inputs contribute independent evidence to a single cultivar assignment.
The reasoning is that the Hawaiian confusions this study set out to address are visual as much as chemical. ISA, IWI, Rahmwanger, Rahmadel and Nene are mistaken for one another because they share green stems and black spots; internode length, spot density and distribution, stem colour and leaf morphology all carry information the near-infrared spectrum does not. The failure modes are also largely independent — spectral errors here came from hydration and session drift, image errors come from lighting and viewing angle — so the two are unlikely to fail on the same plant. For a leaf-scan model at the cross-day accuracy reported above and a stem-image model at 70–80%, the ceiling for a fused decision lies between 86% and 90%.
Preliminary internal evaluation of the combined model, under leave-one-day-out cross-validation, returns accuracy in the 85% range or above across the cultivars tested. That is the same validation scheme under which leaf spectra alone recovered four cultivars at 51.9%, so the two figures are directly comparable and the gain is attributable to the stem imagery rather than to a looser test. These results are unpublished and will be reported in full, with their own validation, separately.
Two refinements are being evaluated alongside it. The first is breaking the single multi-cultivar model into several smaller ones — a noble-versus-tudei gate followed by within-branch cultivar models — which exploits the finding that pairwise discrimination in this dataset was consistently stronger than multi-way discrimination, and which matches the binary shape of most field questions. The second is a confidence threshold below which the instrument returns an inconclusive result rather than a forced answer, letting a nursery route uncertain plants to laboratory confirmation instead of trusting a guess.
How large a validating survey needs to be
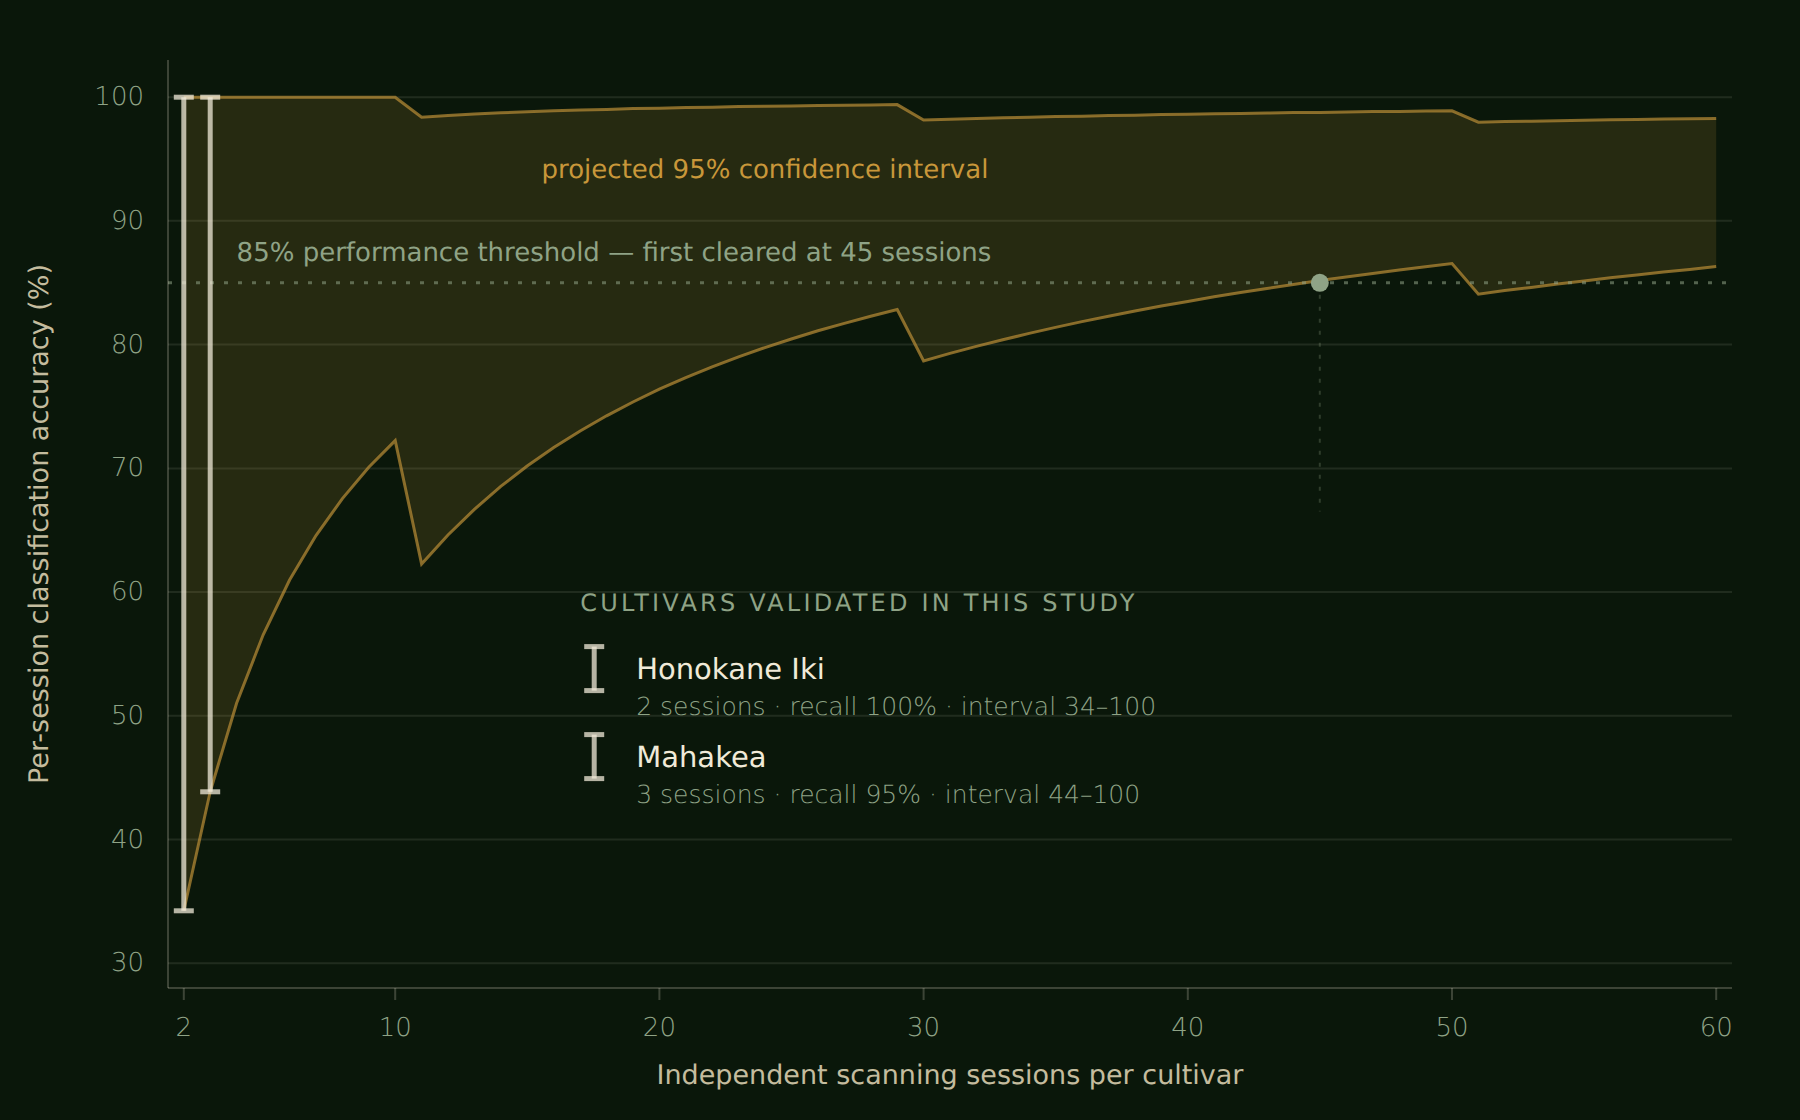
Because power is governed by sessions rather than scans, a survey of 2,506 scans in 51 sessions carries the precision of 51 observations. Assuming a true per-session accuracy of 95%, the 95% Wilson confidence interval narrows only slowly: at three sessions — the best any cultivar reached in 2018 — it spans 0.44 to 1.00, which excludes essentially nothing. At ten sessions it spans 0.72 to 1.00; at twenty, 0.76 to 0.99. For the lower bound to clear a 0.85 performance threshold takes roughly 45 independent sessions per cultivar; to clear 0.90, roughly 127.
That sets up a trade-off between breadth and confidence. Spread evenly across fifteen cultivars, 51 sessions give about three each and an interval roughly 0.56 wide — no better than what 2018 already reports. Concentrated on four cultivars, the same 51 sessions give about thirteen each and an interval roughly 0.24 wide. Neither reaches a defensible per-cultivar claim, but the second is far more informative. A survey meant to validate rather than explore should therefore concentrate on a small panel of commercially important cultivars — the noble-versus-tudei distinction, or the ISA/IWI/Nene confusion specific to Hawaiʻi — rather than sampling many cultivars thinly.
These projections assume each session is an independent draw and that per-session accuracy is constant across cultivars. Both are optimistic: real performance varies by cultivar, and sessions collected on the same day at the same site are unlikely to be fully independent. The session counts above are lower bounds on what a validating study would need.
Where this sits alongside other methods
Since this field work was carried out, Shadrack et al. (2025) have shown that ATR-FTIR spectra of dried, milled kava root and stem material, analysed by artificial neural networks, can resolve geographical origin among four Pacific nations and separate noble from tudei cultivars. That study establishes infrared spectroscopy as a viable basis for kava authentication and is, to our knowledge, the first published demonstration of it.
The approach described here differs on three axes: the near-infrared overtone region rather than the mid-infrared fundamental region, a handheld instrument rather than a benchtop one, and living foliage rather than harvested, dried and milled material. It also asks a different question — which cultivar a plant is within a single origin, rather than where a sample came from. The two are complementary, and together they would bracket the supply chain: handheld near-infrared at the nursery and in the field before harvest, benchtop FTIR on processed material at the point of export or import.
Status
This is a field report on a method under active development, not a validated instrument. In-field cultivar discrimination with a handheld near-infrared spectrometer is feasible and the early results are encouraging: five cultivars separated at 97.7% in a single-day, three-site dataset, and the two cultivars that could be properly cross-validated were recovered at 100% and 95%, one of them across two sites. Set against that, the 2018 sampling design does not permit a validated classifier to be claimed, and three specific artefacts — replicate scanning, session drift and variable leaf hydration — account for a share of the apparent performance.
Work continues on the multimodal classifier, on the decomposed model structure, and on the expanded reference set that the collection protocol above is designed to supply. This page will be updated as that work is validated and published.
Acknowledgements and disclosures
We thank the growers and curators who provided access to their plantings and cultivar records at each site. The field work was made possible by donations from Root of Happiness Kava.
Both authors are affiliated with KavaLytics, which owns the near-infrared instrument used in this study and which is developing the cultivar identification method described here; Tyler Blythe is its Chief Executive Officer. Root of Happiness Kava provided financial support for the field work. The authors declare no other competing interests.
References
- Shadrack, R.S.; Daniel, T.; Tabi, H.; Botleng, J.; Kelep, R.; Regenvanu, L.; Pakoasongi, M.; Butjukabwaelep, E.; Siro, G.; Pipite, A.; Lebot, V. Geographical Origin and Cultivar Differentiation of Kava (Piper methysticum) using Artificial Neural Network with FTIR Spectroscopy: A Novel Method. bioRxiv 2025.10.05.679113. https://doi.org/10.1101/2025.10.05.679113
Cite This
Blythe, T.; Lowin, T. Rapid In-Field Discrimination of Kava Cultivars Using a Handheld Near-Infrared Spectrometer: A Short Multi-Site Field Study in the Hawaiian Islands. American Kava Association Field Report; American Kava Association: Las Vegas, NV, USA, 2026.
Supporting Data and Access
The raw spectral records underlying this report — 2,506 scans in 51 sessions, each carrying instrument serial, device configuration, timestamp and GPS coordinates — are retained by the American Kava Association and are available on request. The 434-scan subset used for the analyses reported here is identified within that archive by collection date.
Write to admin@americankavaassociation.org to enquire.